
Marseille was the finish of the fifth stage of the Tour. After three stages on Corsica and the team time trial in Nice, this stage was a mostly flat 228km from Cagnes-sur-Mer to the Marseille beaches.
Having never been to the Tour in person, I didn't have a good idea of what to expect -- how many people are going to be there? How close to the action can you get? What's the best place to be at? -- and therefore just made up things on the go. I knew that on such a flat stage there most likely would be a mass sprint at the finish and so I decided to head out to the finish area. Wanting to get a good spot, I headed out there on my Le Velo bike share bike several before the projected arrival.
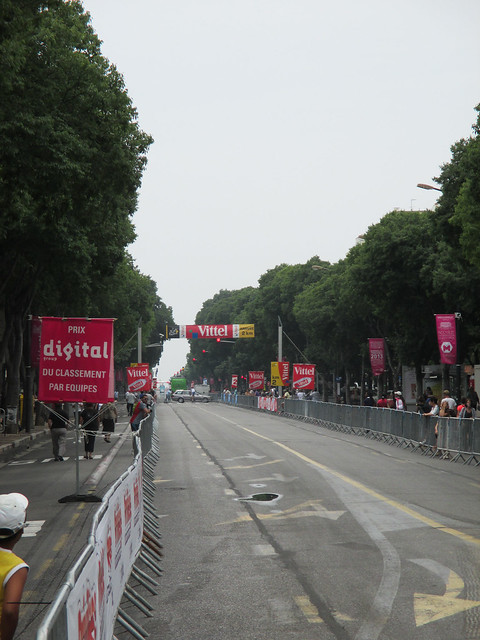
The roads were already closed to car traffic, and as I assumed they'd be closed for cyclists, too, I dropped off my bike and continued on foot along the Avenue du Prado.
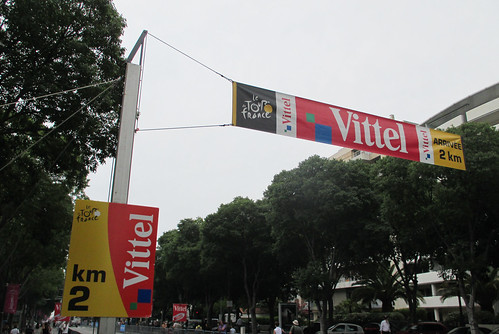
While walking along the wide street and past the 2 km mark a bunch of cyclists passed me on the closed-off section of the road -- I now regretted having dropped off my bike instead of also riding on the same road that the pro riders would soon be on.
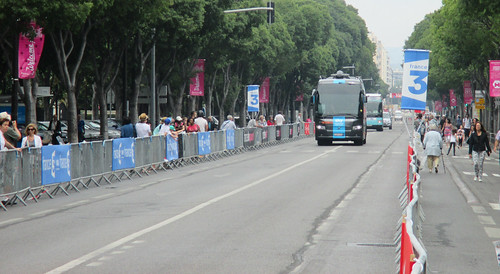
Soon after, the first team buses appeared.
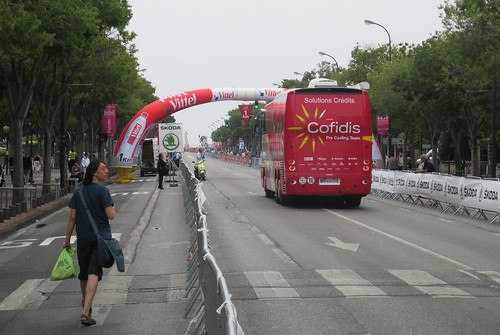
It was quite funny to watch...
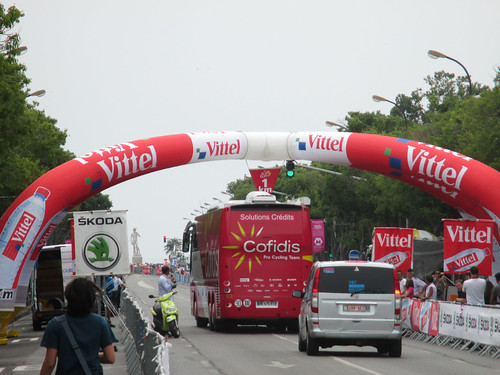
... how carefully they navigated through "la flamme rouge", the marker for the final kilometer. On the very first stage of the Tour in Corsica, a team bus had crashed into the finish line, causing all kinds of complications.
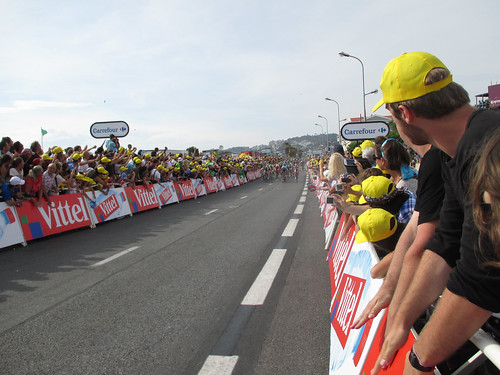
 When I arrived at the final straightaway it was still pretty empty. I walked as far as I could, but access was restricted at the final 200 meter marker. I walked back a little bit and secured myself a nice front row spot at about 220 meters from the finish. Now the waiting began, as the riders wouldn't be arriving for another two hours.
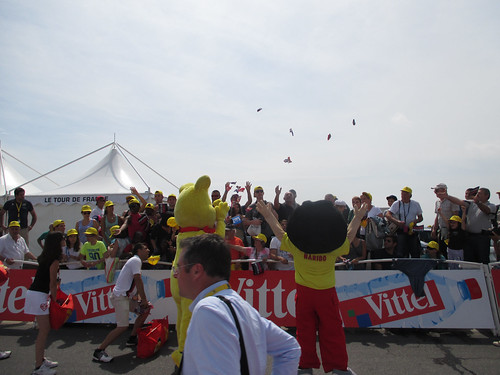
 Fortunately, the Tour organizers try hard to keep spectators entertained, and that's what "La Caravane Publicitaire" is for. It's basically a big parade of all the main sponsors, giving away free crap.
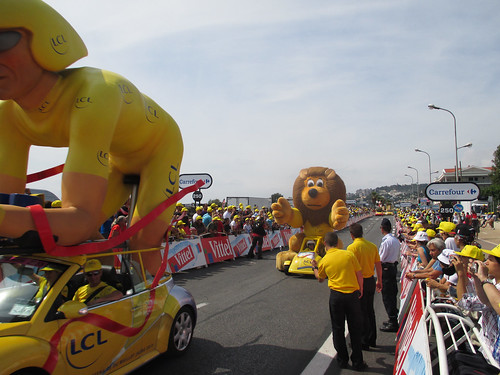 The quality of the floats ranged from "well done and funny"...
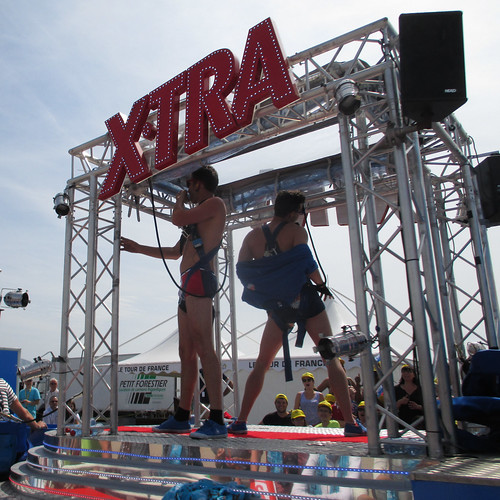 ...to "rather strange."
 What was at least as much fun as watching the caravane itself, was watching how excited people would get over a free bottle of water, polyester hats, or a pack of candy.
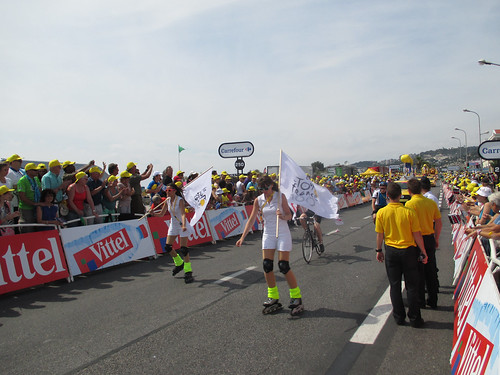
 After the caravane had come through, two groups of young riders came racing through. First the really young ones...
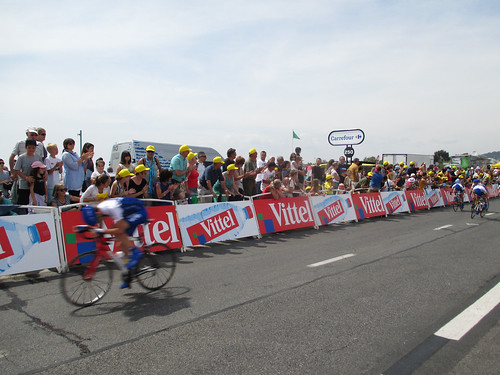 ... then the somewhat older ones sprinting it out.
 The long waiting had taken its toll and I felt increasingly roasted under the Mediterranean sun, but finally the riders arrived! As expected, it was a mass sprint and as such it was over very quickly.
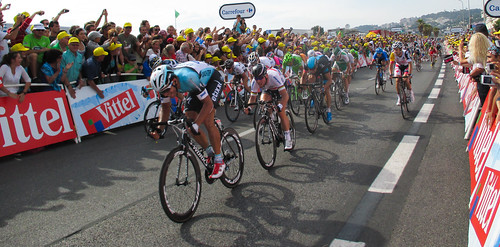 Going all out on the last 200 meters. At this point, Gert Steegmans was in front, but he was only doing the work for his team mate Mark Cavendish right behind him, who would eventually win this stage. If you zoom in on the picture you can see the big crash unfolding in the background.
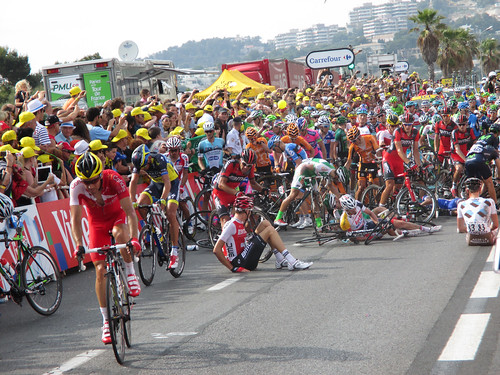 The mass crash looked pretty bad at first, but it seems that nobody got hurt too badly -- which is kind of surprising, given how fast the riders must have been.
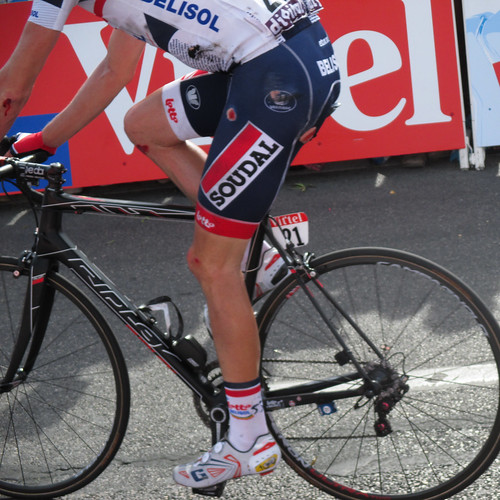 Scrapes and bruises, however, were plentiful. Ouch!
The next part of my Tour reports will follow soon.


